Runtime Traces, Measured: A Map of What Gets Used
In short: I built the service map of Train Ticket, an open-source booking system, twice. Once from 90 recorded runs of traces, and once from its source code. Where both could see, they agreed. Traffic used 90% of the calls written in the code between the services traffic reached, and it made no call the code did not already contain. Scoring each service against known problem shapes moved 1 flag. What traces added was use. One call path carried 20% of all traffic, and 11 of the 38 services never received a request. That makes traces a usage map. For structure, reading the code is cheaper.
My hypothesis was simple. Traces give you a live map of calls, and you can reason about the architecture from that map.
How a request becomes a map
Every earlier post in this series drew the architecture from something written down, such as imports or Git history. A trace is different. It is a record of one request as the system handles it.
Each service a request passes through writes a small record called a span. A span names the service, the operation, how long it took and which span called it. Follow the parent links and the spans form a tree. That tree is the trace. When a parent span sits in one service and its child sits in another, one service called the other. Merge thousands of traces and those calls become a weighted graph of who calls whom.
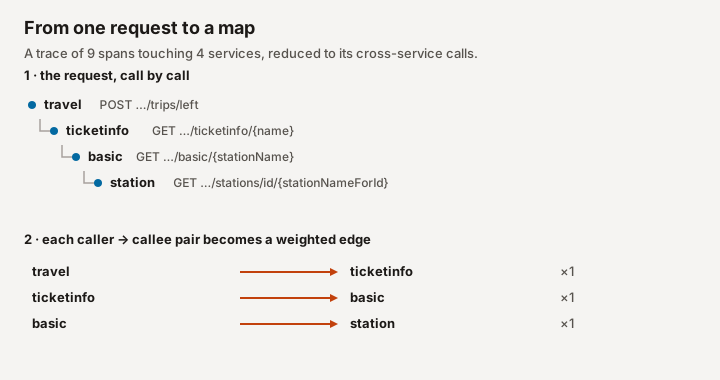
This is not a new idea. Google's Dapper paper described inferring service dependencies from traces in 2010. ING did it for a bank with more than four hundred services. Their code sat in thousands of repositories with no central list of services, so traces were the only practical way to see the whole system. Hübener and colleagues then scored each service against shapes that often signal trouble: a Mega service that everything depends on, a Nano service too small to be worth its own deployment, and a Bottleneck that most paths run through. A flag is a reason to ask, not a verdict. ING had a domain expert judge each one, and some hubs, like authentication, are hubs on purpose.
I wanted to know what such a map tells you that the code does not. So I needed a system where I could have both.
What the live map shows
Train Ticket is a train-booking app that researchers at Fudan University built for microservice studies. Its code is public. The RCAEval benchmark ran it on Kubernetes, sent it simulated users and recorded the traces. I used the 90 runs from its second suite, and only the minutes before each run's injected fault. That is 34,069,338 spans from 295,381 traces.
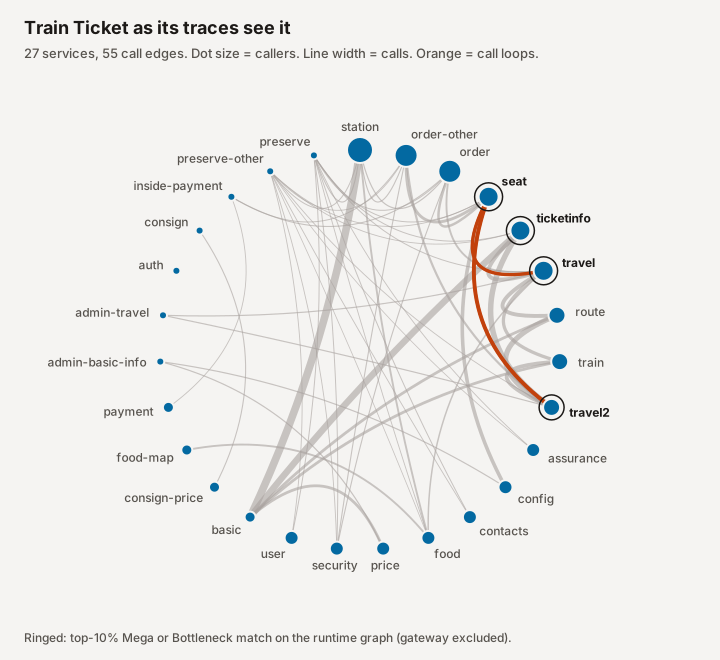
I expected the entry to authorization to dominate, and it does at the front door. 87,530 of the 290,589 requests whose first span was recorded start with a login, about three in ten. But the auth service calls nothing else. The weight piles up deeper. A single edge, basic to station, carried 1,266,855 calls. Those are station-name lookups that sit underneath trip searches. Production systems show the same skew at a larger scale. In Alibaba's traces of about 20,000 microservices, roughly 5% of the services handled about 95% of the calls.
The map also shows how little of each service gets used. Among the services both maps contain, the code gives the station service 7 callers and 9 endpoints. In traffic, 6 services called it, and only 2 of those endpoints were ever hit. The map found 2 call loops, seat with travel and seat with travel2.
What the live map adds is use: which calls carry the load, and which parts of the system go untouched.
Where the map and the code disagree
Train Ticket writes each call as a fixed address in the code, like http://ts-station-service:12345/api/v1/.... So I could build a second map by reading the source of version 0.2.1, the newest release whose endpoints match the traces as well as any other. That gave 38 services and 90 call edges.
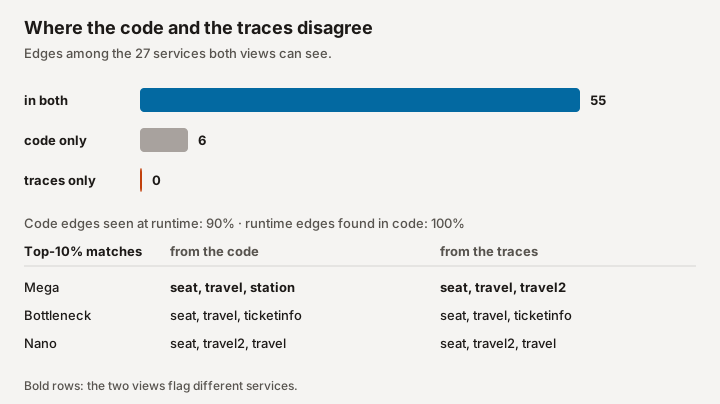
Where both maps could see, they agreed. Every call in the traces was already in the code, so traffic found 100% of its edges there. Train Ticket hard-codes its calls, so the code had no hidden dependencies for the traces to find.
The scoring mostly agreed. Taking the top three services per shape, Bottleneck and Nano matched exactly, and 1 Mega flag moved: station from the code, travel2 from the traces. The Nano match means little. Both maps contain the same two loops, and loop membership counts double in the Nano profile, so it simply picks the three loop members. ING's own cut-offs, tuned on 426 services, disagree more. Their Mega threshold flags 5 services only from the code and 1 only from the traces.
The bigger difference is coverage. 11 services in the code never received a single traced request, including cancel, rebook and three of the five admin services. Those services account for 29 of the code's edges. More recording did not help.
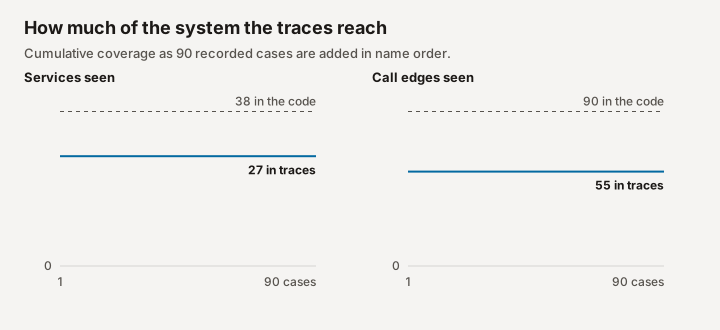
A load generator repeats the same journeys. Any test or staging setup has the same limit: the map only shows the paths someone thought to exercise. ING saw a related gap in production. One of their services showed four dependencies in its traces but really had sixteen, and services on older messaging systems were missed far more often.
What I would use traces for
For architecture reasoning, traces are useful but limited. A few years ago, they were a good way to find which parts of the code were alive and which were dead. Today I can spend about $20 on agents, run a complete analysis of a codebase, and get the structure from that. I think language models are much better than people at reading huge amounts of code. For a person, it is simply too much to hold. In this study, a plain text search over the source already found every call the traces found.
Where traces still earn their place is real data and timing. Timing and structure do meet. Avritzer and colleagues measured coupling in Train Ticket's code, including the propagation cost from part three, and compared it with load tests. In each release they studied, the most coupled endpoint was also the slowest. In testing or on staging, you do not get a complete picture of the data. In production, you do. Data can be strange in ways no test anticipated, and some requests run into network trouble or other problems that only show up there. That is where you see certain traces take a tremendous amount of time, and where it becomes clear which services, requests or procedures cause the most issues. The benchmark here cannot show that. Its traffic is simulated, which is exactly the limit I am describing.
So I would not build a trace pipeline to learn a system's architecture. I am still not sure the architecture view alone justifies the cost. I would turn on tracing in production for the questions code cannot answer: what gets used, how heavily, and where the time goes.
How I measured it, and the limits
Traces. RCAEval RE2 Train Ticket, all 90 runs, Hugging Face revision afeacb1. I kept spans that started before each run's fault injection. A child span in a different service from its parent counts as one call. 501,981 spans had a parent missing from the recording and were left out.
Code. Train Ticket v0.2.1 at commit 350f620. RCAEval does not state the version. Releases 0.1.0 to 0.2.1 contain every traced service and match the same share of traced endpoint paths, so I used the newest. I read every http://ts-…-service address in the Java sources and checked 20 random matches by hand. Messages sent through RabbitMQ, such as food to delivery, appear in neither map.
Scoring. I used the metrics from Hübener's thesis: callers, callees, exposed operations, usage cohesion, betweenness, clustering and cycle membership. I followed the thesis's written description of usage cohesion, because its formula needs operation-level links that code cannot supply. Counting only calls between services both maps contain, each service was scored against the Mega, Nano and Bottleneck profiles over the 27 shared services, and the top ten percent per profile were flagged. Here the Nano profile mostly picks out loop members, since cycle membership carries double weight. The gateway that ING filtered out does not appear in either map.
Scope. Train Ticket is a research system with simulated users. These results describe it, not production systems in general.
References
- Hübener et al., ICSE-SEIP 2022. Anti-pattern detection from distributed traces at ING.
- Hübener, master's thesis, TU Eindhoven 2022. The metric definitions, anti-pattern profiles and ING evaluation used here.
- Sigelman et al., Dapper, Google 2010. Large-scale tracing, including inferring service dependencies from traces.
- Luo et al., SoCC 2021. Call graphs from Alibaba production traces, for a sense of production scale.
- Avritzer et al., Journal of Systems and Software 2026. Coupling measured from Train Ticket's code compared with load-test response times.
- RCAEval. The benchmark and recorded Train Ticket traces.
- Train Ticket. The system under study.