Code Hotspots: Where Complexity and Churn Meet
In short: A hotspot is a file that is both large and frequently changed. I selected hotspots from 18 months of history in five JavaScript projects, then watched an untouched six-month holdout. 325 of 1,809 files caught 446 of 701 later likely bug-fix touches, 3.54 times their share of files. Four repositories produced a sharp shortlist. ESLint barely did, at 1.31 times.
A codebase does not cost the same everywhere. Two cheap measurements, file size and change frequency, pointed at most of the files where later fixes landed.
A 3,499-line warning
Vite has a file called plugins/css.ts. At my training
cutoff it was 3,499 lines long. It had appeared in 127 commits
during the previous 18 months. Both numbers put it well into the
top quarter of Vite's source files.
Then I stopped looking at the training data. Over the next six months, the file changed in 27 more commits. Eighteen had subjects that looked like fixes. They covered CSS chunk maps, null bytes, Sass imports, source maps, minification, asset paths, worker disposal and several other corners of the build pipeline.
None of this says the file is badly written. A CSS pipeline has real surface area, and popular tools receive real edge cases. But if I could review only one Vite file before a risky change, this one would be difficult to ignore. I found it with two cheap measurements: current size and past change frequency.
Lines of code is a rough stand-in for complexity. A long file may contain a table, generated data or repetitive declarations. It can also be a coherent implementation that has not caused trouble in years. Size alone produces a familiar but unhelpful queue: refactor the biggest files first.
Change frequency has the opposite blind spot. A five-line version constant might change every week. So might a lockfile maintained by a bot. Git can tell us where activity happened, but not whether the code was difficult.
A hotspot is the overlap. CodeScene's public documentation uses lines of code as the complexity proxy and commit frequency as the effort proxy. The map matters more than either axis on its own.
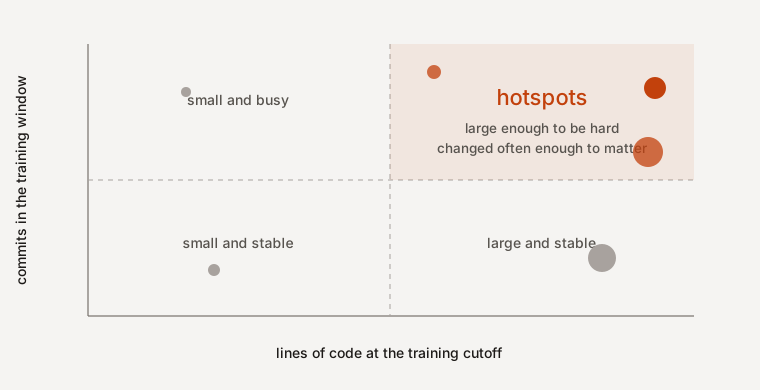
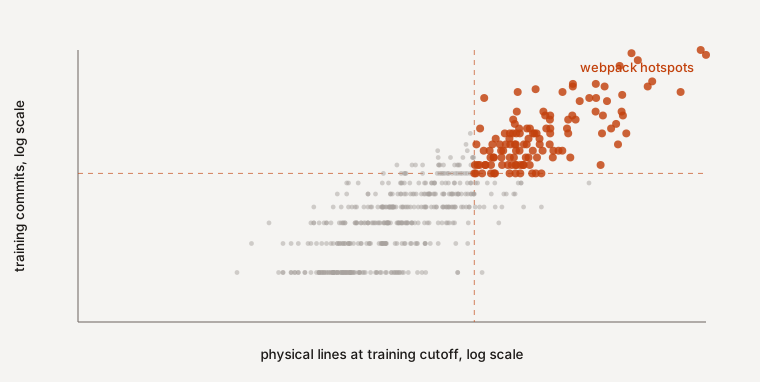
There is no universal border between the quadrants. I used the top quarter on each axis because it is easy to reproduce and does not borrow a commercial scoring model. Ties stay in, so a project may end up with more than exactly 25 percent above a threshold. A file must clear both thresholds to count.
A test with a clock in it
A common hotspot demonstration ranks files and then points out that those same files had many fixes. That reuses the answer as evidence. Since change frequency helps select the files, the conclusion is nearly built in.
I split time instead. For webpack, ESLint, Prettier, Rollup and Vite, I took the 24 months before the pinned commit used in the earlier posts. The first 18 months are training. File size comes from the tree at that cutoff, and non-merge commits provide the revision count. The last six months are a holdout that cannot affect hotspot selection.
In the holdout, I count each source file once per commit. A
subject containing words such as fix, bug,
defect or corrected marks a likely fix.
This is the same conservative heuristic as the
architecture-debt experiment.
It misses fixes with vague subjects and admits some false
positives. It is not a Jira defect record.
18 percent of the files, 64 percent of the fixes
Across all five repositories, 325 of 1,809 files qualified as hotspots. That is 18 percent of the files. They held 57.3 percent of the source lines and received 50.5 percent of all later file touches. More importantly for the test, they received 446 of 701 likely bug-fix touches, or 63.6 percent.
Their share of fix activity was 3.54 times their share of files. That ratio is a prioritization lift, not a claim that hotspots caused the bugs. It tells me how much more concentrated the review queue became after using the two filters.
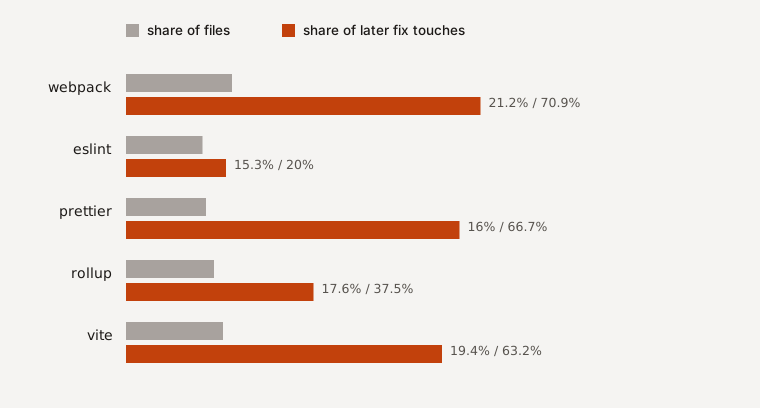
| repository | hotspots/files | later fix touches | lift |
|---|---|---|---|
| webpack | 122/576 | 70.9% | 3.34x |
| eslint | 59/386 | 20% | 1.31x |
| prettier | 73/456 | 66.7% | 4.17x |
| rollup | 47/267 | 37.5% | 2.13x |
| vite | 24/124 | 63.2% | 3.26x |
Prettier produced the sharpest queue. Its 73 hotspot files were 16 percent of the source tree and took 66.7 percent of later fix touches, a 4.17x lift. webpack was close. ESLint was not. Its hotspots covered 15.3 percent of files and only 20 percent of fix touches. A 1.31x lift is better than random selection, but not by much.
That weak ESLint result is useful. The metric is not a law. A
project can move work into new files, stabilize an old subsystem,
or have a short holdout with few fixes. ESLint's training leaders
included linter.js and rule-tester.js, yet
neither attracted a likely fix in the holdout. Past pressure can
fade.
The most quoted numbers near hotspot analysis come from Adam Tornhill and Markus Borg's 2022 "Code Red" paper: 15 times more defects, 124 percent longer issue resolution and about nine times longer maximum resolution time in low-quality code.
Those are not results for the size-plus-frequency method above. The paper studied CodeScene's proprietary Code Health score. That score combines many source-code signals on a 1 to 10 scale. The study placed files at 8 or above in the healthy group and files at 4 or below in the alert group. Hotspot activity is how CodeScene decides where that health score matters most.
The dataset contained 30,737 files from 39 proprietary production systems linked to Jira and version-control data. Healthy files averaged 0.25 reported defects; alert files averaged 3.70. That is the 14.8 ratio rounded to 15. Average development time rose from 7,816 to 17,545 minutes. Maximum time rose from 15,112 to 129,940 minutes.
The study found a strong association, with statistically significant group differences. It did not prove direction. The authors say so: difficult code may create defects, repeated defect work may damage the code, or both may follow another factor. Only 350 files, 1.14 percent of the sample, were in the alert group. The projects were CodeScene customers and C++ was the most common language. The numbers deserve attention, but they do not turn any red square on a map into a causal diagnosis.
My own result survives reasonable threshold changes. Using the top 20 percent on each axis selected 259 files and caught 58.6% of fix touches. The default top 25 percent selected 325 and caught 63.6%. At top 30 percent, 409 files caught 67.9%. The queue grows, the coverage rises, and the lift falls from 4.10x to 3.00x. That is the expected trade.
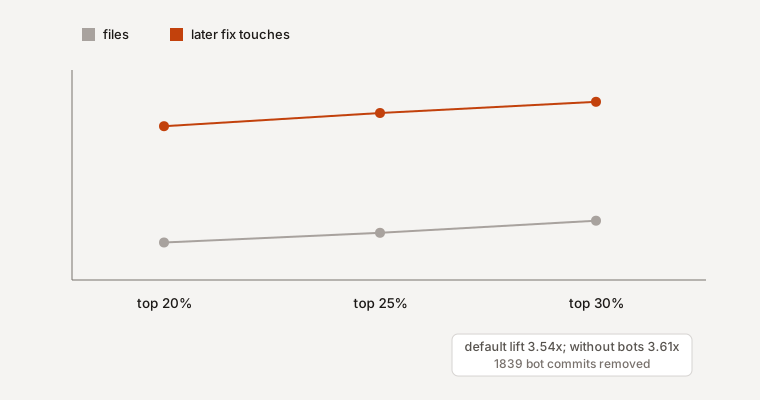
Bot traffic is a newer and messier problem. A 2026 MSR study of 91 repositories reported that automated accounts made 74 percent of the line-level hotspot edits it examined. In my data, removing 1,839 bot commits changed the aggregate set from 325 files to 317. The fix-touch lift moved from 3.54 to 3.61 times. Most excluded bot commits never touched the selected source boundaries, which explains the small effect here. That will not be true for every repository, especially when generated files and dependency manifests sit inside the analysis boundary.
How I would use the map
I would run this analysis before quarterly planning or a risky subsystem change. Pick a recent window, exclude generated and test code, and plot size against revisions. Then read the first few files in the upper-right corner with their commit history open.
Some hotspots will be healthy centers of the design. Leave them alone, but review their changes carefully. Some will contain mixed responsibilities or recurring workarounds. Those are good refactoring candidates. Others will be release files, bots or bulk migrations that need to be removed from the data. The map finds where to investigate. The code and its history explain why.
The test here has limits. Commit subjects stand in for linked defects. File touches stand in for effort. All five subjects are open-source JavaScript tools, and the six-month holdout is short. The size and revision thresholds are relative within each project, so the numbers should not be used to rank projects against one another.
The hotspot method turned 1,809 files into a review queue of 325. That queue caught 63.6 percent of likely bug-fix touches in a later six-month window, 3.54 times its share of files. Four repositories produced a sharp shortlist. ESLint barely did. I would use the map to choose what to read first, then make the refactoring decision from the code and its history.
References
- Adam Tornhill and Markus Borg, "Code Red: The Business Impact of Code Quality", International Conference on Technical Debt 2022. Source of the 39-system Code Health results and their stated validity limits.
- CodeScene, "Hotspots". The public definition based on file size and change frequency.
- Saleha Muzammil, Mughees Ur Rehman, Zoe Kotti and Diomidis Spinellis, "Source Code Hotspots: A Diagnostic Method for Quality Issues", MSR 2026. Source of the 91-repository bot-noise result.